Depending on their data, users can choose from three ready-to-use story templates, each designed for different communication and analysis needs.
Project Details
Project: MoDaS – Mobility Data Story Suite: From Mobility Data to Storytelling
Funding Context: mFUND (BMDV)
Consortium: TU Ilmenau, fluxguide
Project Duration: September 2023 – August 2026
fluxguide’s Contribution: UX design, web development, data visualization and development of an open-source tool for interactive storytelling
Benefits: Complex mobility data is transformed into accessible, visually engaging stories that support understanding and inform decision-making processes.
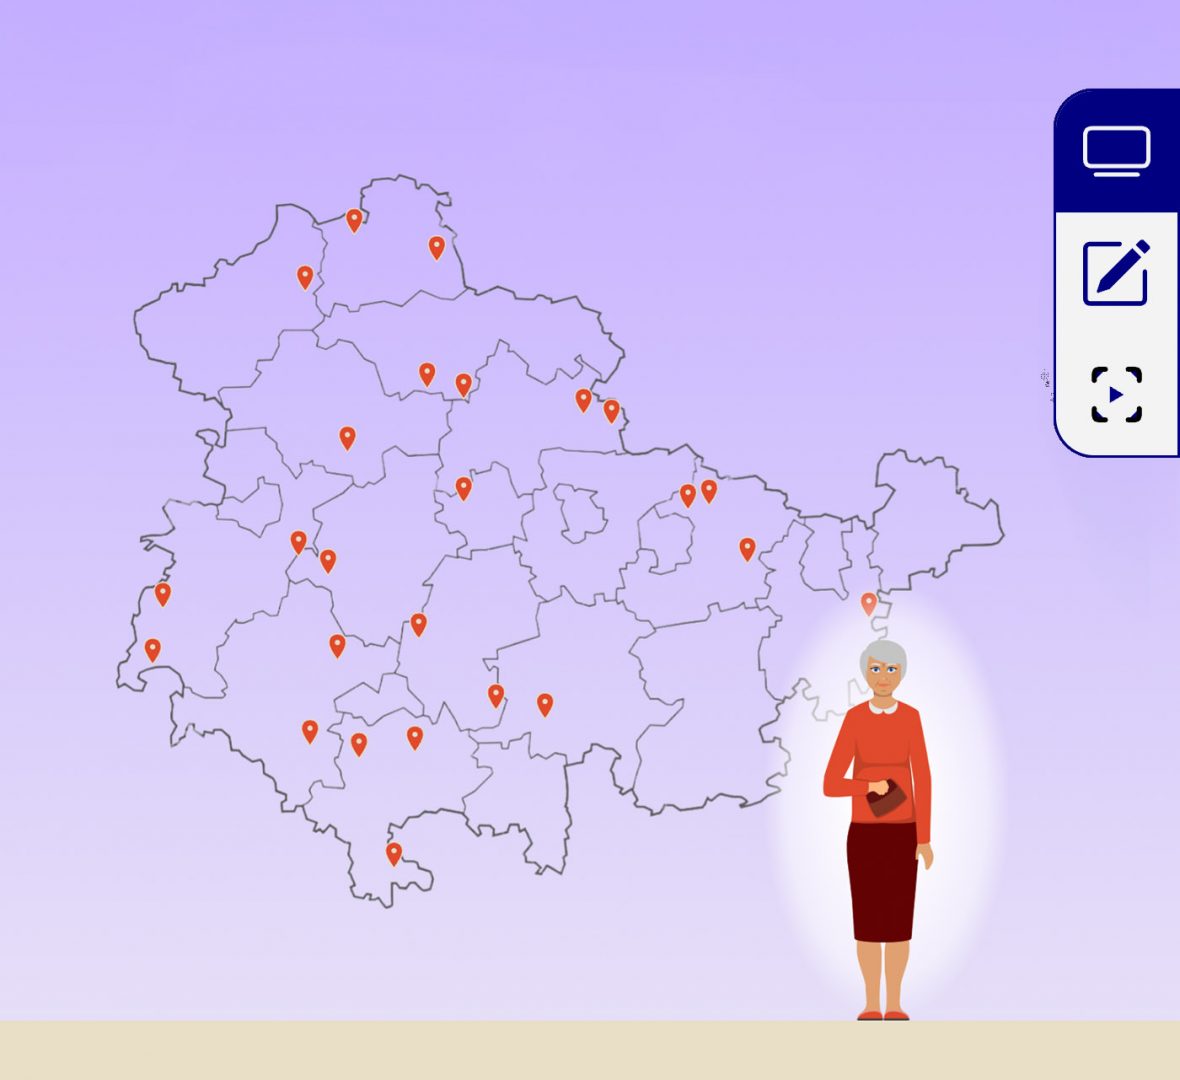
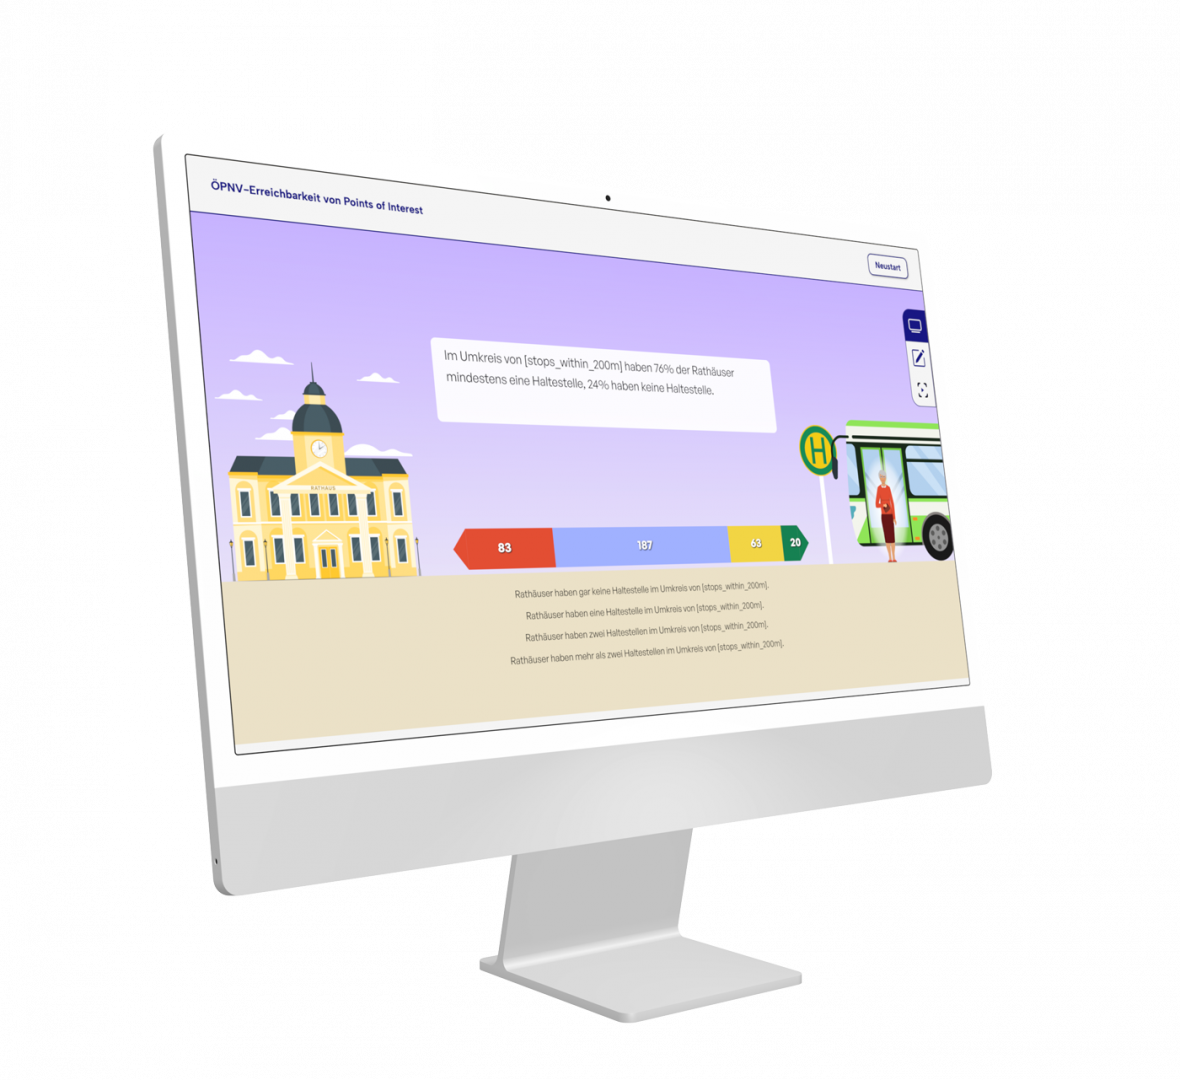
Story 1: Public Transport Accessibility
This story shows how well key locations such as schools and town halls are connected to public transport. Static and interactive maps, together with 2D visualizations, highlight accessibility, opportunities, and gaps in the public transport network at a glance.
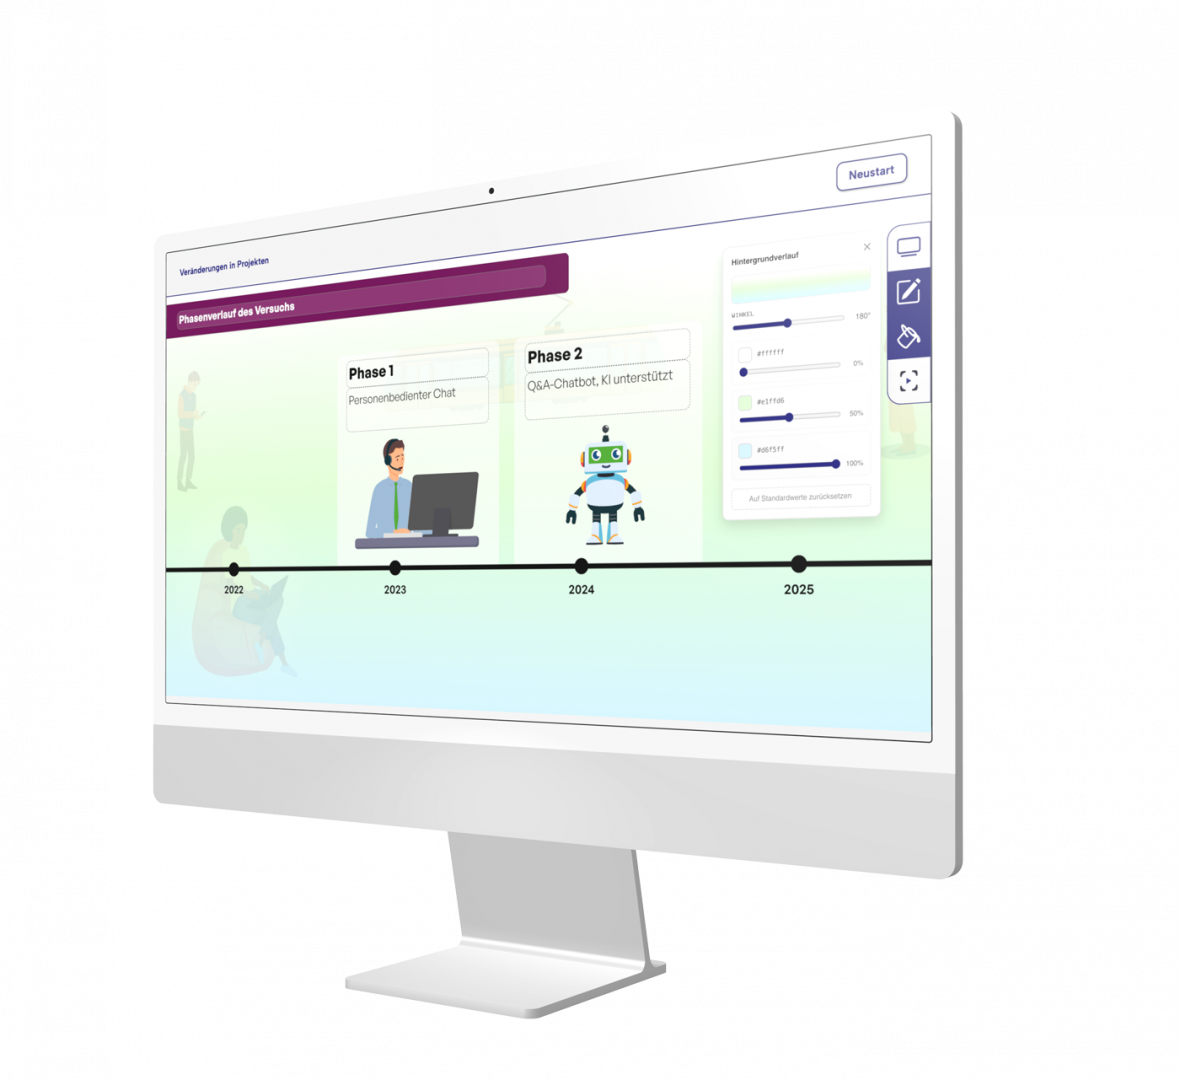
Story 2: Project Evolution
This story illustrates how public transport operators and mobility projects have evolved over time, for example in customer communication or other areas of the organization. An interactive timeline, supported by charts and graphics, makes these developments easy to explore and understand.
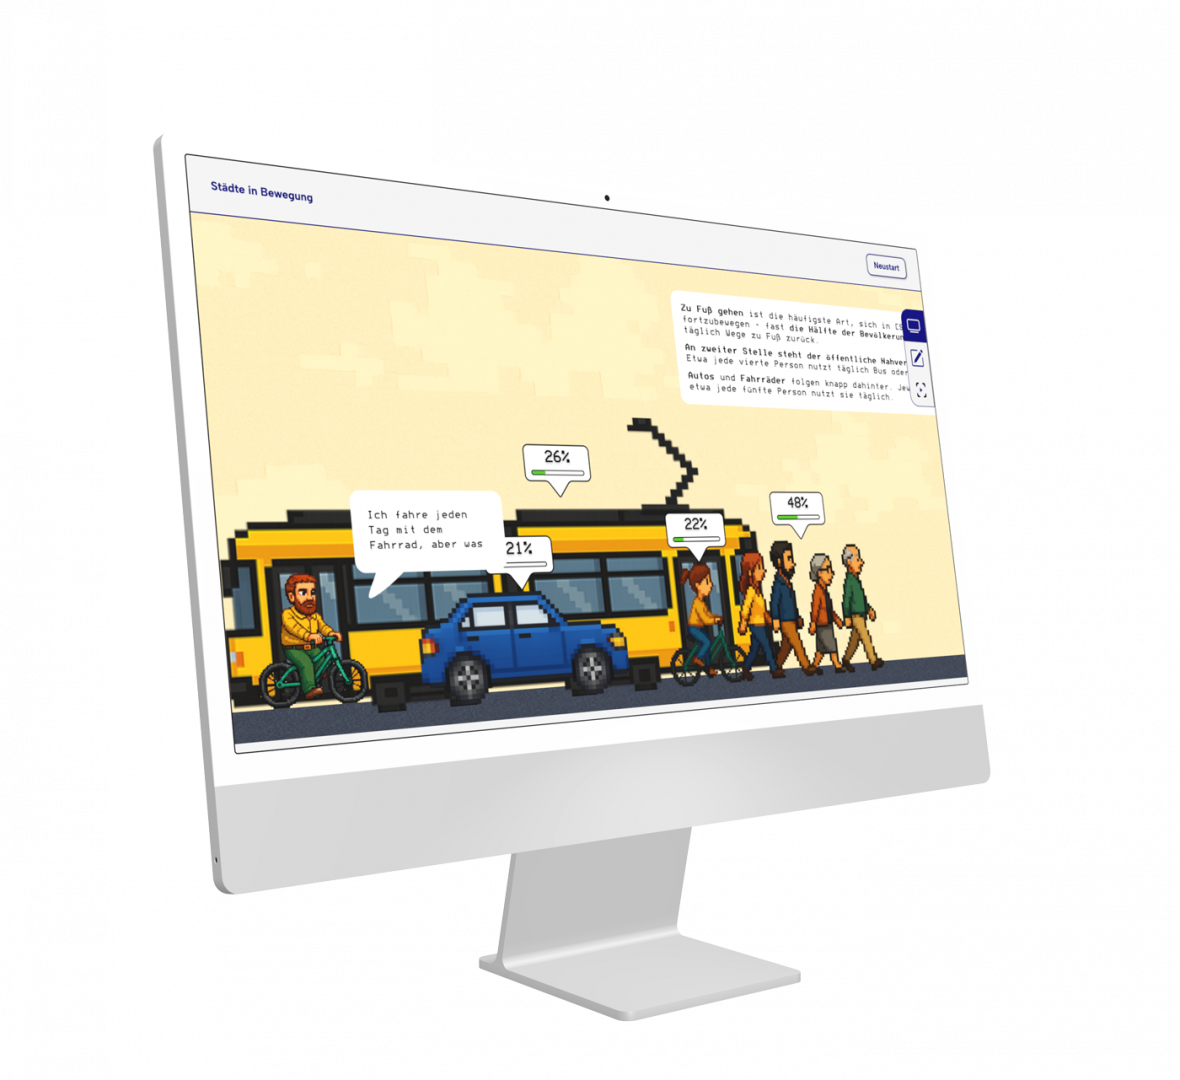
Story 3: Cities in Motion
This story brings urban mobility survey data to life through interactive storytelling. Users can begin by selecting different categories, such as regions or target groups. A charming retro pixel-art Scrollytelling experience then guides them through the data, revealing mobility patterns and the diverse perspectives of different groups of road users.
Create Your Mobility Data Story
The Mobility Data Story Suite (MoDaS) transforms complex mobility data into interactive, engaging experiences. Using modern data storytelling, it turns data into clear, compelling narratives that provide context, reveal insights, and support informed decision-making.
Designed for policy makers, transport planners, and citizens alike, the MoDaS Suite helps make mobility planning processes more efficient, transparent, and accessible.
Discover the MoDaS Suite and turn your mobility data into compelling stories.
Together with the Technical University of Munich, Hof University of Applied Sciences and other partners, we will be researching innovative solutions over the next three years to make public transport in rural areas more efficient.
Project aim and realisation
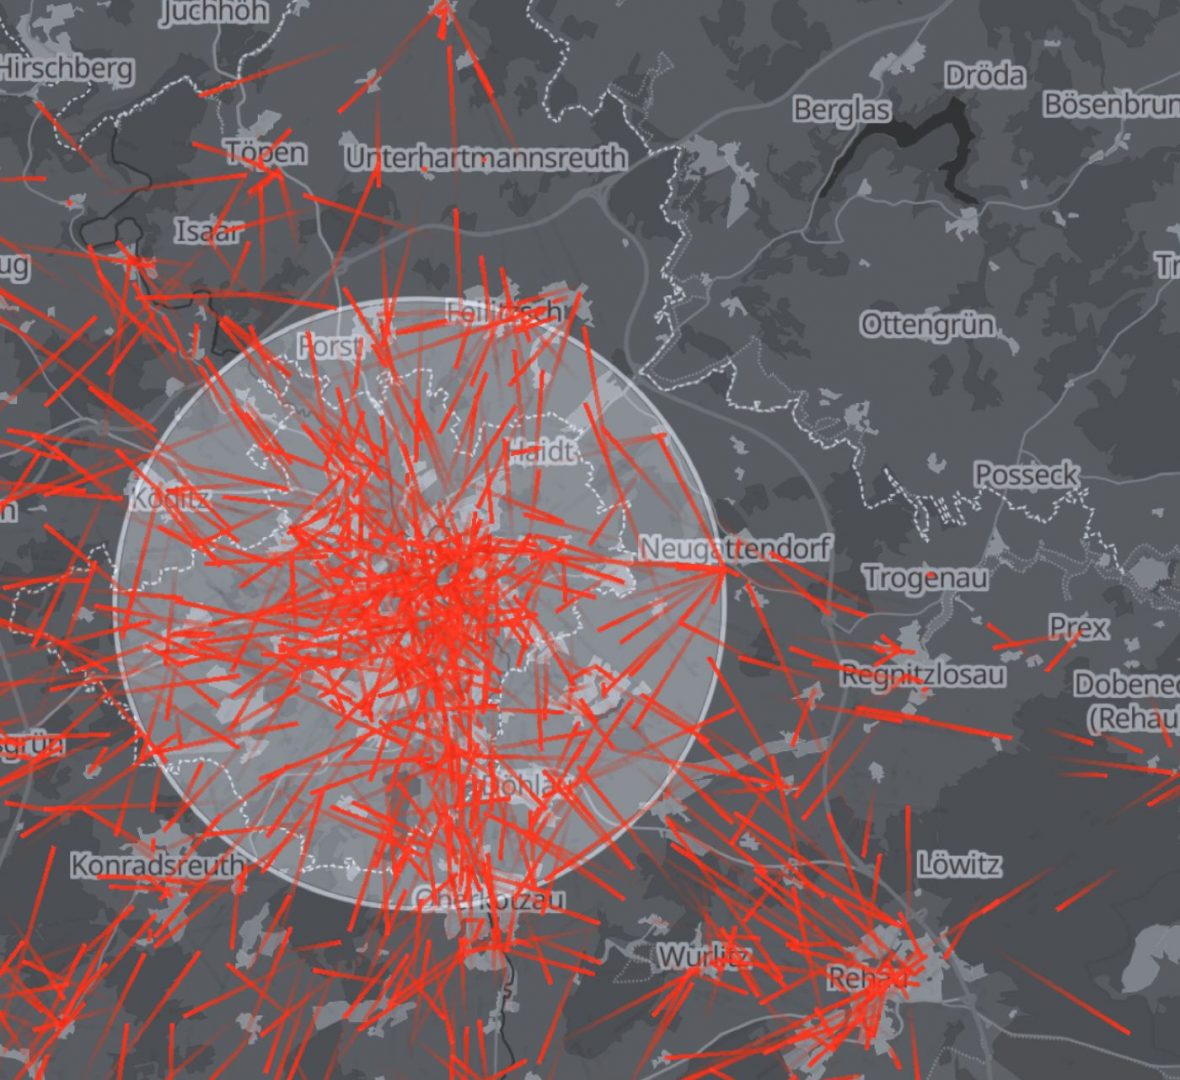
The “EMILIA” research project aims to optimize local public transportation in rural areas by developing digital tools. To evaluate service offerings, the project is developing a simulation in the form of a digital twin. With the help of optimization tools, the service offerings can then be improved and re-evaluated using the simulation. To develop these tools, the project utilizes structural, movement, and usage data from existing mobility services, as well as analytical methods—including neural networks.
The project begins with the creation of a database serving as a virtual representation of the region (data lake). This data is used to analyze transportation needs and mode of transport selection. Building on this, a realistic simulation and optimization tools are implemented and integrated with one another. This allows for the partial automation of planning steps, such as the placement of stops and the creation of schedules, as well as their review and optimization. To facilitate interaction with planners, the project is exploring new visualization methods for depicting the complex interrelationships within this planning context.
Translated with DeepL.com (free version)
The project is scheduled to run from 1 July 2024 to 30 June 2027 and is funded by the Federal Ministry for Digital and Transport (BMDV) as part of the mFUND innovation initiative.